This is the second installment of the Household Debt and Credit Report review of 2024. This post expands on the previous <link> takeaways to see how they are trending with this month’s new dataset release. With that being said, let’s jump into things.
Previous Takeaways from May 2024 with August 2024 commentary (bold text from May)
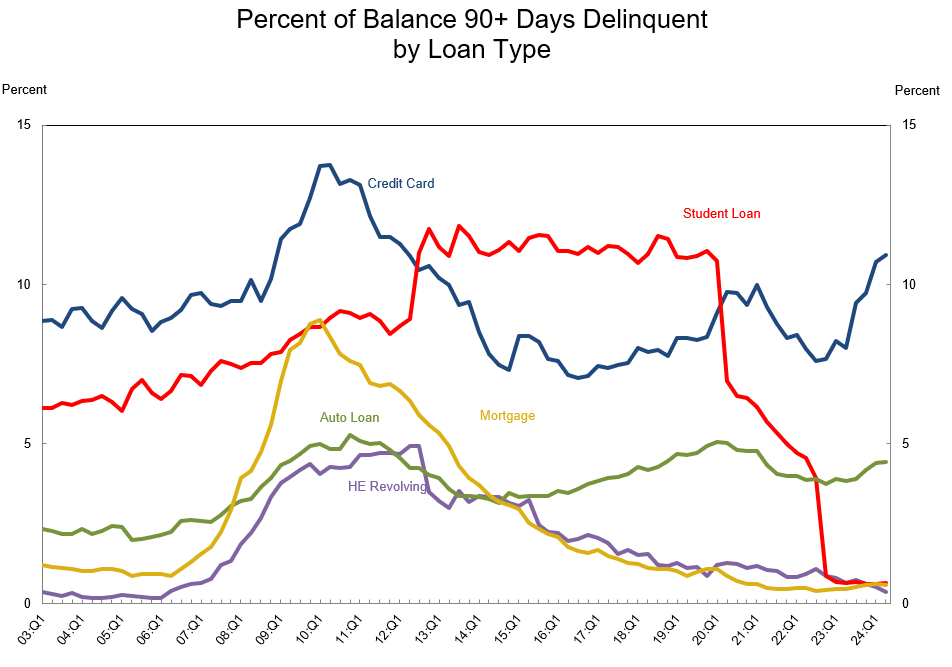
- Credit card 90 day+ delinquencies are higher than Q1 2008 (9.49) versus today at 10.69 an increase of 12%.
This trend has continued with Credit Card 90 day+ delinquencies rising to 10.93, an increase of 2.2%. The acceleration may have begun turning a corner, however, this level is still in line with the Great Financial Crisis. This heightened level continues to indicate that consumer spending remains tight. For example, banks continue to allocate larger sums of funds for loan and credit writeoffs.
Capital One for example increased their provisions by almost 50% <link> “Provision for credit losses increased $1.2 billion to $3.9 billion”. With Commercial Real Estate continuing the trend downwards financial institutions are facing risk on multiple fronts.
- Student Loan Delinquencies have not yet kicked in, as of Q1 student loan delinquencies stood at 0.62%
The previous iteration of this report suggested that the lifting of the forbearance period for student loans would begin to show it’s head in Q2. However, Student Loan Delinquencies remain low at 0.65%. This previous post did not account for the continued legal battle over this topic.
In a new ruling <link> as of August 9th, the 8th Circuit Court delivered another hurdle to the current administration’s plan to forgive $475 billion in student loans. It is becoming more apparent why the current administration is fighting so hard to win this battle. This is the most likely cause of the continued high consumer spending, which is keeping the economy out of a potential recession. Let’s expand on this.
The average rate for Student Loan Delinquencies is 11.16 from 2012-2019. Of the $475B being proposed, that’s $53B per year in delinquencies being avoided. Since consumers are not required to pay these debts at the moment, they are able to pay off other balances and debts. Even with this help from the current administration, credit card delinquencies are still on the rise. Student Loans currently make up 9% (1.59T / 17.8T) of the overall Household Debt in Q2. Looking back to the great financial crisis, the TARP bailout of banking is estimated to cost LESS (~435B) than this bailout of selectively poor performing student loans. Is the US economy resilient enough to withstand such a change in consumer spending should student loans return to previous levels?
- Meanwhile “phantom” debt that isn’t included in this report from “Buy Now Pay Later” is ballooning.
This continues to be an unclear variable in the household debt and credit health for the US. Future earnings later in August for companies like Affirm may lead to signals on how their loan portfolios are performing compared to other forms of credit.
New Takeaways
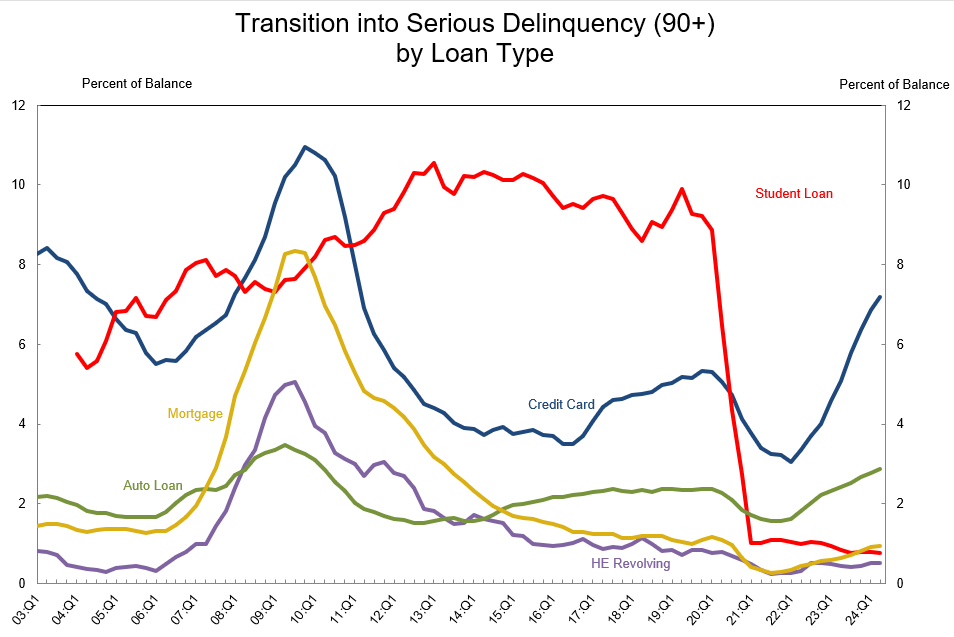
There is a noticeable and rapid rate of growth in auto and credit loans becoming “Seriously Delinquent”, meaning 90+ days past due. Will these get amplified with student loans in the future? Since these trends are leading indicators, it is likely we will continue to see noticeable growth in the number of seriously delinquent loans of all different types.
Anyways, I hope these trends go down and the US economy remains healthy. There’s been a lot of economic uncertainty in the recent months and I fear there will be more ahead. As always, I’m not an expert on these topics

Leave a comment